Hallo Peter,

dann schreibt man aus der Hilfe ab:

Clear[DaughterNuclides, ReachableNuclides, DaughterNuclidesQ, \
AlphaDecayQ]
DaughterNuclides[s_List] :=
 DeleteCases[
  Union[Apply[Join,
    Map[IsotopeData[#, "DaughterNuclides"] &,
     DeleteCases[s, _Missing]]]], _Missing]
DaughterNuclidesQ[s1_,
  s2_] := (s1 =!= s2 && MemberQ[DaughterNuclides[{s1}], s2])
AlphaDecayQ[s1_,
  s2_] := (s1 =!= s2 && MemberQ[DaughterNuclides[{s1}], s2] &&
   Abs[IsotopeData[s1, "MassNumber"] -
      IsotopeData[s2, "MassNumber"]] == 4 &&
   Abs[IsotopeData[s1, "AtomicNumber"] -
      IsotopeData[s2, "AtomicNumber"]] == 2)
ReachableNuclides[s_List] :=
 FixedPoint[Union[Join[#, DaughterNuclides[#]]] &, s]

nur die boolean function AlpahDecayQ ist "neu".

Schaut man die Zerfälle von Plutonium 241 an (analog zur Hilfe)

Clear[vertsPu241]
vertsPu241 = ReachableNuclides[{Entity["Isotope", "Plutonium241"]}]

RelationGraph[DaughterNuclidesQ, vertsPu241, Sequence[VertexLabels -> {
    Entity["Isotope", "Actinium225"] ->
     Row[{Superscript["", 225], "Ac"}],
    Entity["Isotope", "Americium241"] ->
     Row[{Superscript["", 241], "Am"}],
    Entity["Isotope", "Astatine217"] ->
     Row[{Superscript["", 217], "At"}],
    Entity["Isotope", "Bismuth209"] ->
     Row[{Superscript["", 209], "Bi"}],
    Entity["Isotope", "Bismuth211"] ->
     Row[{Superscript["", 211], "Bi"}],
    Entity["Isotope", "Bismuth213"] ->
     Row[{Superscript["", 213], "Bi"}],
    Entity["Isotope", "Francium221"] ->
     Row[{Superscript["", 221], "Fr"}],
    Entity["Isotope", "Lead207"] -> Row[{Superscript["", 207], "Pb"}],
     Entity["Isotope", "Lead209"] ->
     Row[{Superscript["", 209], "Pb"}],
    Entity["Isotope", "Mercury205"] ->
     Row[{Superscript["", 205], "Hg"}],
    Entity["Isotope", "Neptunium237"] ->
     Row[{Superscript["", 237], "Np"}],
    Entity["Isotope", "Plutonium241"] ->
     Row[{Superscript["", 241], "Pu"}],
    Entity["Isotope", "Polonium211"] ->
     Row[{Superscript["", 211], "Po"}],
    Entity["Isotope", "Polonium213"] ->
     Row[{Superscript["", 213], "Po"}],
    Entity["Isotope", "Protactinium233"] ->
     Row[{Superscript["", 233], "Pa"}],
    Entity["Isotope", "Radium221"] ->
     Row[{Superscript["", 221], "Ra"}],
    Entity["Isotope", "Radium225"] ->
     Row[{Superscript["", 225], "Ra"}],
    Entity["Isotope", "Radon217"] ->
     Row[{Superscript["", 217], "Rn"}],
    Entity["Isotope", "Thallium205"] ->
     Row[{Superscript["", 205], "Tl"}],
    Entity["Isotope", "Thallium207"] ->
     Row[{Superscript["", 207], "Tl"}],
    Entity["Isotope", "Thallium209"] ->
     Row[{Superscript["", 209], "Tl"}],
    Entity["Isotope", "Thorium229"] ->
     Row[{Superscript["", 229], "Th"}],
    Entity["Isotope", "Uranium233"] ->
     Row[{Superscript["", 233], "U"}],
    Entity["Isotope", "Uranium237"] ->
     Row[{Superscript["", 237], "U"}]}, PlotRangePadding -> 0.65,
  ImageSize -> 300, PlotTheme -> "Scientific"]]
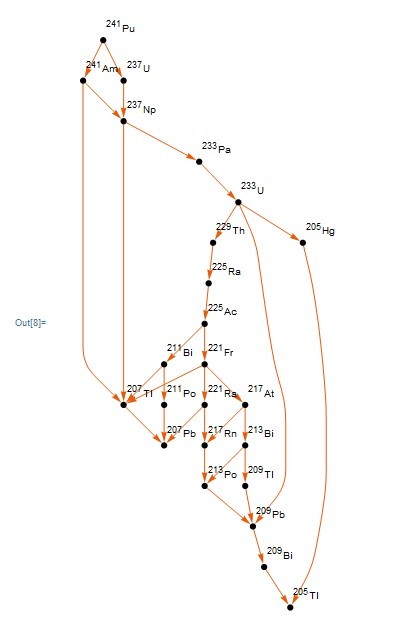
entsteht das Bildchen klamser-pu241 anhand dessen man ahnt, dass der
Alphazerfälle des Plutoniums nicht viele sein werden, es geht von Pu-241
zu U-237 (Alphazerfall) und dann zu 237 Np (Betazerfall), die Kette der
aufeinanderfolgenden Alphazerfälle ab Pu-241 endet.
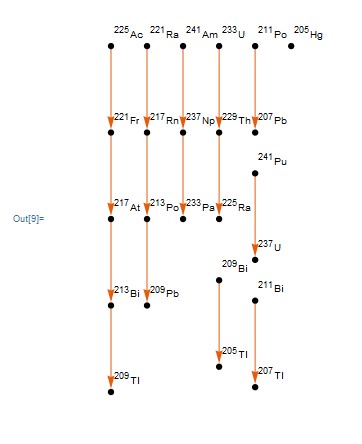
But anyway, das folgende Bild

RelationGraph[AlphaDecayQ, vertsPu241, Sequence[VertexLabels -> {
    Entity["Isotope", "Actinium225"] ->
     Row[{Superscript["", 225], "Ac"}],
    Entity["Isotope", "Americium241"] ->
     Row[{Superscript["", 241], "Am"}],
    Entity["Isotope", "Astatine217"] ->
     Row[{Superscript["", 217], "At"}],
    Entity["Isotope", "Bismuth209"] ->
     Row[{Superscript["", 209], "Bi"}],
    Entity["Isotope", "Bismuth211"] ->
     Row[{Superscript["", 211], "Bi"}],
    Entity["Isotope", "Bismuth213"] ->
     Row[{Superscript["", 213], "Bi"}],
    Entity["Isotope", "Francium221"] ->
     Row[{Superscript["", 221], "Fr"}],
    Entity["Isotope", "Lead207"] -> Row[{Superscript["", 207], "Pb"}],
     Entity["Isotope", "Lead209"] ->
     Row[{Superscript["", 209], "Pb"}],
    Entity["Isotope", "Mercury205"] ->
     Row[{Superscript["", 205], "Hg"}],
    Entity["Isotope", "Neptunium237"] ->
     Row[{Superscript["", 237], "Np"}],
    Entity["Isotope", "Plutonium241"] ->
     Row[{Superscript["", 241], "Pu"}],
    Entity["Isotope", "Polonium211"] ->
     Row[{Superscript["", 211], "Po"}],
    Entity["Isotope", "Polonium213"] ->
     Row[{Superscript["", 213], "Po"}],
    Entity["Isotope", "Protactinium233"] ->
     Row[{Superscript["", 233], "Pa"}],
    Entity["Isotope", "Radium221"] ->
     Row[{Superscript["", 221], "Ra"}],
    Entity["Isotope", "Radium225"] ->
     Row[{Superscript["", 225], "Ra"}],
    Entity["Isotope", "Radon217"] ->
     Row[{Superscript["", 217], "Rn"}],
    Entity["Isotope", "Thallium205"] ->
     Row[{Superscript["", 205], "Tl"}],
    Entity["Isotope", "Thallium207"] ->
     Row[{Superscript["", 207], "Tl"}],
    Entity["Isotope", "Thallium209"] ->
     Row[{Superscript["", 209], "Tl"}],
    Entity["Isotope", "Thorium229"] ->
     Row[{Superscript["", 229], "Th"}],
    Entity["Isotope", "Uranium233"] ->
     Row[{Superscript["", 233], "U"}],
    Entity["Isotope", "Uranium237"] ->
     Row[{Superscript["", 237], "U"}]}, PlotRangePadding -> 0.65,
  ImageSize -> 300, PlotTheme -> "Scientific"]]
(klamser-pu241-alpha) zeigt dies gerad so, aber es gibt eine lange Kette
von Ac-225 bis T-209.
Die direkten Daten zeigen ebenso, dass U-237 keinen Alphazerfall hat:

In[10]:= IsotopeData[Entity["Isotope", "Plutonium241"], "DecayModes"]
Out[10]= {"BetaDecay", "AlphaEmission", "SpontaneousFission"}

In[11]:= IsotopeData[Entity["Isotope", "Uranium237"], "DecayModes"]
Out[11]= {"BetaDecay"}

Ein kurzes Vergnügen.
Aufgabe: Finden Sie die längste Kette aufeinanderfolgender Alphazerfälle
in den IsotopeData[], Peter; ein Exemplar der kürzesten Kette wurde nun
gerade gefunden.
Grüsse
Udo.
On Sat, 14 Sep 2019 10:46:20 +0200, Udo und Susanne Krause via demug <demug@XXXXXXX.ch> wrote:
Hallo Peter,

das folgt der üblichen Mathematicaprogrammierung, machen wir zunächst
einen Arrayplot der bei Wolfram bekannten Isotope

In[45]:= Clear[isotopenPlot]
isotopenPlot[] := With[{zMax = 120, aMax = 300},
   ArrayPlot[
    Table[If[
      Head[Quiet[
         Check[IsotopeData[{o, oo}, "StandardName"],
          0, {IsotopeData::notent}]]] === String,
      1, (* else *)
      0 ], {o, zMax}, {oo, aMax}],
    ColorRules -> {1 -> Cyan, 0 -> Yellow}, Mesh -> {zMax, aMax}/5,
    Frame -> True, FrameTicks -> Automatic, FrameLabel -> {"Z", "A"},
    PlotLabel -> "Wolfram::Isotope"]
   ]

auf einschlägigen Seiten findet man, dass Kernladungszahlen > 120 und
Massenzahlen > 300 nicht gemischelt werden konnten, demnach nicht
existieren. Das gibt das Bild im Anhang.

Jetzt müssten Sie wg.

X^{A}_{Z} -> Y^{A-4}_{Z-2} + He^{4}_{2} + dE

was der Alphazerfall in LaTeX-Notation ist, die Kette herunterlaufen, mit
DaughterNuclides kontrollieren, dass Y ein daughter nuclide von X ist, dieHalbwertszeit abholen und dieses rekursiv ausführen, bis kein Zweig mehr Töchter meldet. Am Schluss einen schönen Graphen fertigen. Go ahead! Grüsse Udo. On Sun, 08 Sep 2019 20:30:31 +0200, Peter Klamser via demug <demug@XXXXXXX.ch> wrote:Hallo, Ich würde gerne mit MMA12 über IsotopeData["Pu241", "HalfLife"] eine Liste der Zerfallsprodukte in der Zerfallskette mit der jeweiligen Halbwertszeit nur für Alphazerfälle erstellen. Die Beispiele bei wri.com sind sehr komplex. Weiß jemand wie das geht? Danke sagt Peter _______________________________________________ DMUG Deutschsprachiges Mathematica-Forum demug@XXXXXXX.ch http://www.mathematica.ch/mailman/listinfo/demug Archiv: http://www.mathematica.ch/archiv.html
![]() klamser-pu241.jpg
klamser-pu241.jpg
Description: JPEG image
![]() klamser-pu241-alpha.jpg
klamser-pu241-alpha.jpg
Description: JPEG image
_______________________________________________
DMUG Deutschsprachiges Mathematica-Forum demug@XXXXXXX.ch
http://www.mathematica.ch/mailman/listinfo/demug
Archiv: http://www.mathematica.ch/archiv.html